Article
Try As You Might, Timesheets Will Never Be Accurate
And is time spent to create X even a good measure of productivity to begin with?
Intro
When ad agencies or creative studios mature, they eventually enter a phase where they want to gain an understanding of their per-unit economics. They’ll become curious as to whether certain strategic motions can manipulate (and ideally lift!) their profits over time.
Asking employees to track time spent against certain clients, projects, or task types often appears to be the logical solution. But does it yield reliable data?
Situation
Imagine a creative production studio that sells its services to customers via an itemized rate card — here’s a table of fictional rates to illustrate this common pricing model among production companies:
| Deliverable | Rate |
|---|---|
| Campaign concept | $3,000 |
| Campaign landing page design | $2,000 |
| Production of one social media video ad | $1,000 |
(In a real world rate card, these rates would obviously be accompanied by lots of definitions and assumptions.)
This studio’s rate card was created in response to competitive market data, but is not rooted in any data about level of effort, as this studio does not track time spent. While rates evolved year over year based on P&L analysis, all that’s been done to date is an annual comparison of total earnings versus total cost of goods sold (COGS).
What this studio knows: it’s profitable.
What it doesn’t know: which deliverables are high margin, and which ones are low margin? Which rates can we lower in response to client pressure, which ones do we need to defend or even raise due to insufficient profit?
But leadership wants to learn, so that pricing decision can be made not just in response to client or market pressure, but also based on a foundation of in-house data.
Hypothesis
If time spent on each deliverable is tracked by all employees, profitability analysis of each rate card item will be possible, enabling the company to publish or negotiate rate changes with absolute predictability of impacts not just on revenue, but also on profits. This new data source will also enable ongoing calculations of the studio’s financial performance throughout the year, drastically improving forecast-ability, compared to the status quo (once annual P&L evaluation).
Action 1: Timesheets are introduced
From now on, all members of this studio (creatives and producers) log their time against clients, projects, and deliverable types. A tool like Harvest can make this process as least tedious as possible, offering multiple convenient features (like API integrations with Asana and Slack, a native stopwatch app for Mac, calendar sync to add meetings to timesheets, etc.).
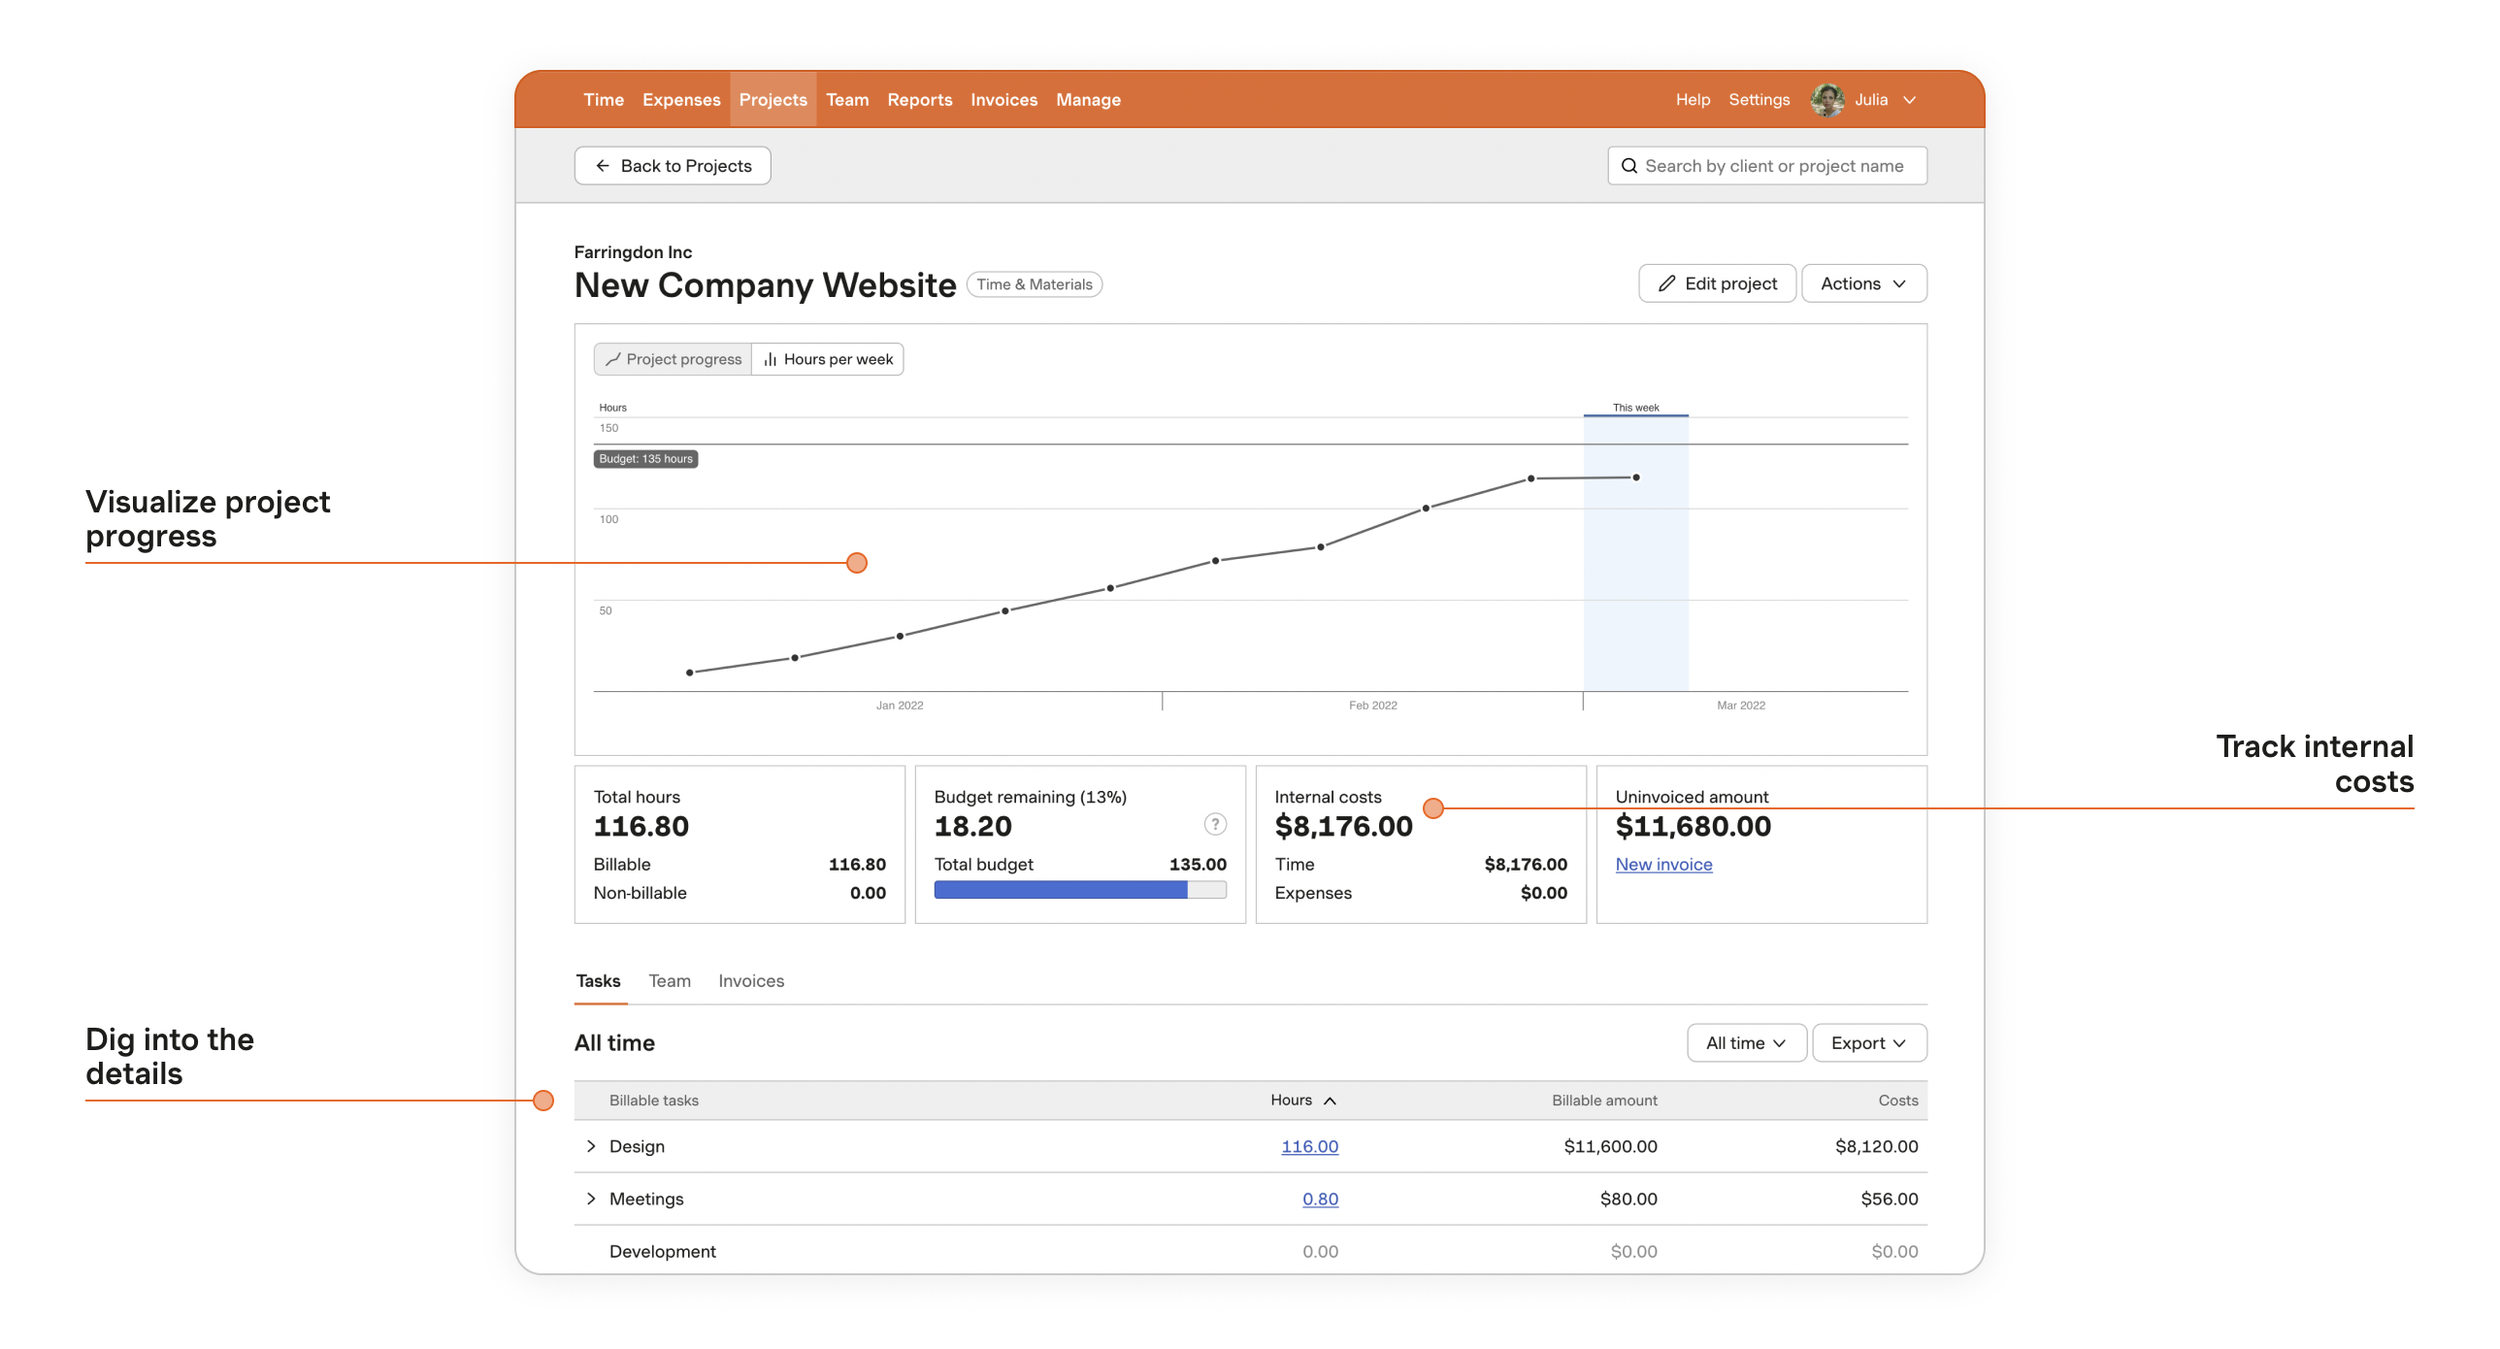
(Screenshot taken from Harvest’s website)
Department leadership has access to employee salaries and associated overhead costs, and can now calculate each person’s cost contribution to any given deliverable, project, or client, simply by multiplying logged hours with individual cost rates.
This allows a simple calculation of a project’s (or client’s, or deliverable’s) profitability.
Example
Project Scope
| Deliverables | Quantity | Rate | Fee |
|---|---|---|---|
| Campaign concept | 1 | $3,000 | $3,000 |
| Campaign landing page design | 1 | $2,000 | $2,000 |
| Production of social media video ad | 10 | $700 | $7,000 |
| Total | $12,000 | ||
In this sample project, a customer orders $12,000 worth of work from the studio. Work begins, and employees track their time throughout the project:
Project Timesheet
| Deliverables | Employee | Cost/hr | Hours | Cost |
|---|---|---|---|---|
| Campaign concept | Creative Director | $150 | 3 | $450 |
| Designer | $100 | 7 | $320 | |
| Copywriter | $100 | 5 | $1,970 | |
| Producer | $80 | 4 | $320 | |
| Cost of deliverable | $1,970 | |||
| Campaign landing page design | Creative Director | $150 | 2 | $300 |
| Designer | $100 | 10 | $1,000 | |
| Copywriter | $100 | 4 | $400 | |
| Producer | $80 | 6 | $480 | |
| Cost of deliverable | $2,180 | |||
| Production of social media video ads | Creative Director | $150 | 7 | $1,050 |
| Designer | $100 | 8 | $800 | |
| Video Editor | $120 | 30 | $3,600 | |
| Copywriter | $100 | 5 | $500 | |
| Producer | $80 |
12 | $960 | |
| Cost of deliverable | $6,910 | |||
| Grand Total | $11,060 | |||
At the end of the project, the total calculated project cost (time spent * hourly cost rates) comes to $11,060. Profit can be calculated:
Profit Analysis
| Deliverable | Revenue | Cost | Profit | Margin |
|---|---|---|---|---|
| Campaign concept | $3,000 | $1,970 | $1,030 | 34.33% |
| Campaign landing page design | $2,000 | $2,180 | –$180 | –9.00% |
| Production of social media video ads | $7,000 | $6,910 | $90 | 1.28% |
| Project Total | $12,000 | $11,060 | $940 | 7.80% |
While the project overall had a margin of 7.8% for the company (which would be rather low in the real world, where most creative service providers tend to strive to earn margins of at least between 15-25% on average), we can see that our deliverables weren’t equally successful in contributing to those results:
The campaign concept turned out to be profitable above average.
The campaign landing page design however turned out to be causing a loss.
The production of social media videos ads was barely profitable.
Action 2: Rate card changes are made
Profit analysis results from many projects over time are used to inform changes to the rate card. If, for example, we assume that the findings from our sample scenario above repeat themselves in other projects, the company could deduce that some of our rates should change:
Campaign concept could be made more affordable, unless the company considers the currently high margin justified for a deliverable with a high amount of added value for the customer.
Campaign landing page is costing the company more than it brings in. A significant rate increase would be needed, unless ways can be found to reduce time spent on delivery without jeopardizing production quality.
Production of social media video ads, while profitable, is not contributing to the company’s margin goal of 15-25%. A moderate 18% price increase from $700 to $825 per deliverable could raise the margin from the currently observed ~1% to a more acceptable 16%.
The End?
Regular pricing optimization cycles as described above give a creative services company a seemingly effective tool for controlling profit margins.
But what if we’ve wrongly assumed the entire time that our timesheet data is… accurate?
And is the time spent by everyone completing their timesheets even a productive use of their valuable and expensive time?
Considerations
We are human. Being human means two things in the context of timesheets: Sometimes we make mistakes. And sometimes we let subjective feelings prevail over objective logic.
Mistakes
Maybe we logged time to the wrong project. Maybe we forgot to use automated timing tools and instead relied on our memory (or a look at last week’s calendar) to retroactively cobble together a timesheet that “feels about right”. Small mistakes like that have a chance to be found and corrected easily, and they don’t tend to manipulate the overall timesheet data in a significant way. Learnings from data that is slightly incorrect that way, but was collected by people who generally care about the accuracy of the data they enter, is still usable for learnings as the ones described in our example above.
Subjectivity
But that quickly changes when subjectivity and anxiety (both of which are perfectly human) come into play. Think of any of the following scenarios. If you’ve ever had to do timesheets in one of your jobs, maybe you’ve felt like this at times yourself.
An employee might:
log more time than actually spent on a task, out of fear of not looking busy enough, or to protect current work/life balance by wanting to look busier than they are, so that no additional work gets assigned to them by managers monitoring resource allocation.
log less time than actually spent on a task, out of fear of looking inefficient or slow. They think that it would surely not be good to be found out as the slowest of the bunch when it comes to a task that their peers do in half the amount of time.
log exactly what was allocated to the task during its planning stage, regardless of how much they actually spent completing the task. They think that this way they can make the project “look good” in post delivery reports.
log more time than actually spent, because they work much faster than expected. And because the client might have paid for the planned amount of time, they feel that their hyper-efficient delivery earned themselves a slow afternoon.
change their timesheet behavior from time to time based on the company’s or their own economic circumstances. An employee in fear of losing their job might take on an underreported overtime workload, in hopes of making themselves indispensable, and to appear highly productive.
Opportunity Costs
Doing timesheets costs more than just the tooling fees. I estimate that average employees spend 1-2 hours per week tracking time or correcting timesheets. So 5% of what you pay your people goes towards tracking time. Think about that! You pay someone $100,000 a year, and $5,000 of that is spent on tracking time, and should be considered as an add on to your tooling costs.
Rather than costing the company $5,000 a year in lost opportunity, those ~100 hours a year spent per IC employee logging time (and likely much more by managers in charge of analyzing, correcting, and reporting on timesheets to leadership) could be sold instead to customers at a profit, e.g. at $100 an hour for an extra $10,000 in annual revenue per employee.
Conclusion
Asking employees to log time seems to be a logical step when trying to evaluate pricing strategies and financial success metrics. But it can be highly flawed.
To be fair: while “time spent to complete task” is not a perfect metric of productivity or value (you wouldn’t say that a meal that takes twice as long to cook will definitely taste twice as good and would be worth twice the price), it’s still the most commonly used data point to approximate level of effort in the creative services industry. This is due to the nature of creative work being not perfectly repeatable. Two projects with identical scopes and identical people involved will never be guaranteed to take the exact same amount of time.
To make timesheets a reliable data source, it takes experienced leaders who can teach their teams the why and how of timesheets accuracy. Since inaccurate timesheets are useless (and at times even counterproductive), managers need to be able to lead with empathy and emotional intelligence to have a chance to show their teams that subjectivity and anxiety can be detrimental to the shared mission.
In my work as a manager, I have always tried to explain how timesheets can be mutually beneficial for both the company and the employee: Companies can use them to secure profits (e.g. think data backed pricing changes, discussed above), which adds to everyone’s feelings of job security and a healthy work-life balance (accurately reported time protects employees from being overloaded with work).
And if you have found a better system than timesheets to collect data on employee productivity in an environment of non-standardized deliverables, I’d love to hear from you and discuss your thoughts!